Understanding Inflation
It appears that inflation is a term that we will become very familiar with over the next few months, and potentially years. In the Bitcoin spirit of don’t trust, verify this article aims to empower readers by exploring what inflation is and where to look for original sources of data. Armed with this information, you will be able to form your own opinion and prepare for the future accordingly. Like most things, the reality is quite different to how it is portrayed in the mainstream media.
Monetary Supply Inflation
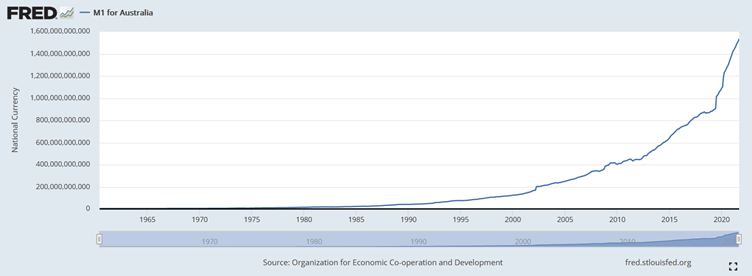
Technically the term inflation refers to monetary-supply-inflation, although we commonly use it to describe prices. We’ll get to prices later on. With Bitcoin, supply inflation occurs when new coins are mined. Every ten minutes or so, 6.25 new bitcoin are awarded to the successful miner of a block, which results in an annual inflation rate of 1.83%. Importantly, miners do work to earn these rewards, including purchasing and maintaining expensive hardware and paying for electricity to run these machines. This rate of inflation will ultimately decline to zero when bitcoin reaches its maximum supply of 21 million coins, one of the key reasons many people choose to save with bitcoin. The Australian dollar has different definitions of money supply, but the one most commonly used by economists is called M1. The M1 money supply for the Australian dollar, as of September, was $1.561 Trillion. This has increased by 15.8% in the last 12 months and has doubled in five years. This data is freely available here. Keep in mind that there is no cost to creating additional dollars and there is no upper limit on the money supply.
Where is the money going?
Australia’s M1 has been increasing at a rapid rate for decades. In the late 1990’s it was $100 Billion; it’s now 15 times that amount. So, why is inflation only becoming a discussion point now? Unlike historical episodes of hyperinflation, in modern times new money is not literally printed. The Reserve Bank of Australia (RBA) creates new money, as an accounting record, and then effectively loans this new money to the Australian government by purchasing Australian government bonds. This allows the government to spend more than it otherwise could based on tax receipts. The resulting increased demand for bonds has the effect of reducing their interest rates, which is one of the RBA’s intended outcomes. Lower interest rates make it possible for people to take out larger loans. In general, banks make loans when there is an asset, such as a house, which they can repossess if the loan goes bad. Hence, lower interest rates have lead to a cycle of banks approving larger loans, which are used to bid up the price of houses. This allows banks to lend even more because now the assets (the houses) are worth more, so it’s safer to loan more against them. And so on, until nobody can afford to live in Sydney.
Consumer Price Index (CPI)
Most people are more familiar with CPI, which is the figure quoted in the news and referenced when we receive a pay increase. CPI is often a very different number to M1 supply inflation for a few key reasons. Firstly, it is intended to be a calculation of the price changes that are being felt by the average Australian. If your purchasing habits differ from the average, then your costs will also vary from the CPI. Secondly, productivity and technology improvements have the impact of reducing some prices. For example, emails save the cost of a postage stamp. Finally, CPI excludes a key cost that impacts everyone. When housing is calculated in CPI, it only includes the cost of the house, not the land underneath the house. The reason given for this is that the land is not consumed and therefore it is not included in CPI. Regardless of whether this methodology is valid, it has the impact of keeping CPI much lower than house price increases. CPI is currently 3% in Australia. New data is released quarterly by the Australian Bureau of Statistics (ABS) here.
Producer Price Index (PPI)
Many countries publish a Producer Price Index, which is essentially a CPI but for industry. Think about a factory that produces bread. It needs to buy ingredients to make the bread, such as wheat, as well as packaging materials. These materials all need to be transported to the factory where the act of making bread requires workers who command a salary and electricity to run the machines. Each of these items have costs which vary based on a myriad factors such as the weather (wheat) or the price of oil (transport). The PPI is a useful metric to understand, as it allows you to predict the future. If you know that a bread factory’s costs are increasing by 10%, you can be pretty confident that the price of bread will rise by a similar amount. The ABS also publishes PPI data. Australia’s PPI was 2.9% for the September quarter, which appears benign, but further digging uncovers some worrisome data. For example, the manufacturing industry is experiencing an 11.2% increase in annual costs. Fortunately, we are faring better than some other countries. In Germany, PPI has increased 18.4% in the last year, while energy is up a staggering 48% annually.
Signs to watch for
As mentioned above, even though money supply has been expanding for decades, this has mostly impacted asset prices, such as houses, and not everyday consumables. The PPI is telling us that this might be starting to change, and that essentials such as food, energy and transport might become a pain point in the household budget. There are a few signs to watch for.
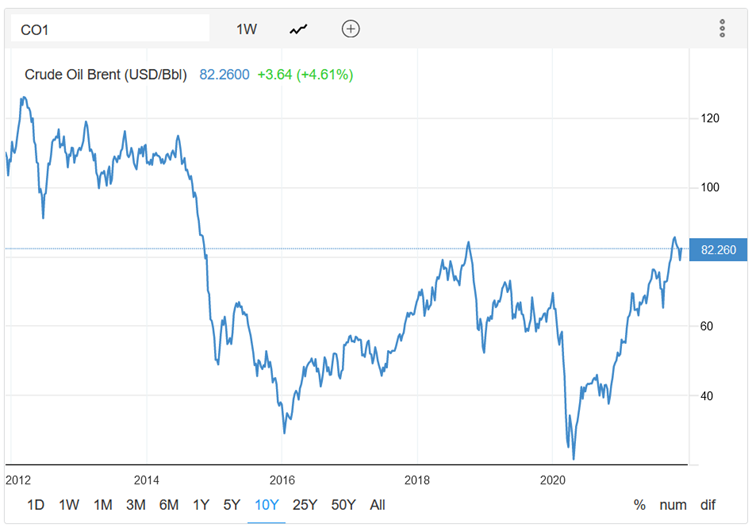
The first is the price of Brent Crude Oil, the key oil price indicator outside of the US. Trucks, ships, tractors and combine harvesters all run on diesel, which is derived from oil. If the price of oil rises, this will flow through to the price of pretty much everything at the supermarket.
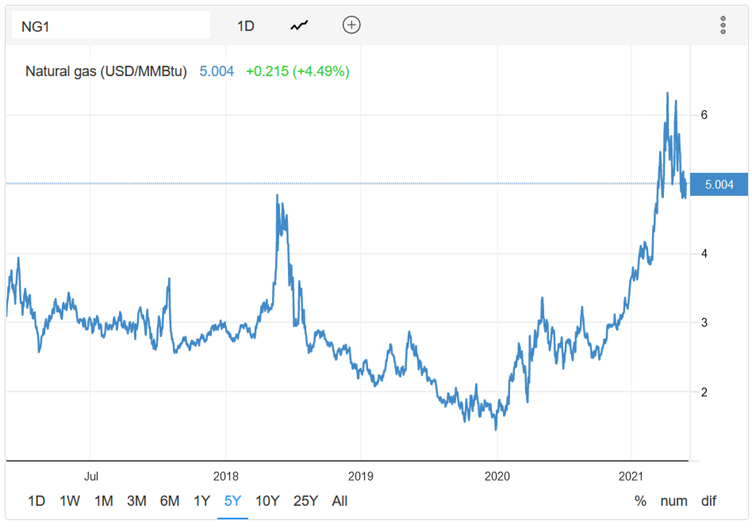
Next is the price of natural gas. This energy source is a gas at room temperature and can only be transported cost effectively through a pipeline, unless it is cooled to a liquid at a dedicated (and very expensive) export facility. This means that the price at one location can vary significantly from another. Natural gas is used for heating and cooking, particularly in Victoria. It is also used to generate around 20% of Australia’s electricity, and in SA, WA and NT it’s around half. Finally, natural gas is required to make nitrogen fertiliser, which is a key input to agriculture.
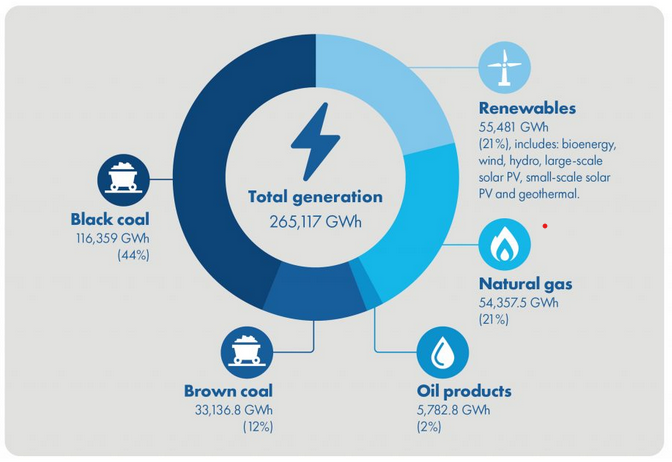
While we might not like to admit it, Australia is still generating around half its electricity from coal. Nobody is using coal anymore, so that should be cheap, right?
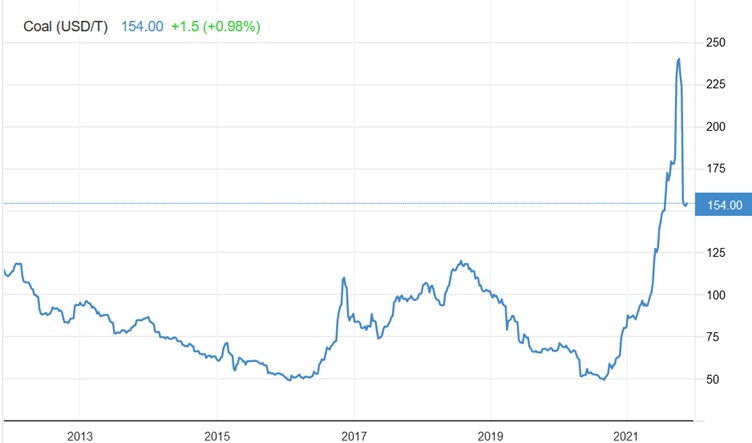
As the above charts show, the prices of oil, natural gas and coal have been rising rapidly this year. This will flow into the costs of electricity, food, heating and transport in the near future, impacting everyone. Lower income earners will be impacted the most - those who have the least wriggle room in their weekly budget. This will quite likely result in industrial action of workers seeking higher salaries so that they can afford their essentials. The increased wages will then increase PPI, which will flow through to CPI and prices will continue to spiral upward. If you observe the government attempting to solve this problem by creating even more money then be prepared for prices to get seriously out of control. While we believe bitcoin to be an excellent way to save in an inflationary environment, we do also acknowledge that you can’t eat bitcoin, and so stocking up on food may not be a bad idea either.