This is part one of a two-part post where I will look back at 2022 and make predictions for the future.
You can also listen to an audio version of this post on the Australian Bitcoin podcast.
The second part will focus on discussing what occurred in Bitcoin development and adoption in 2022.
This post is about something I get asked a lot about, the price action of the past year and my predictions for the future.
All prices mentioned are in $US.
The usual disclaimers:
- These are simply my thoughts and predictions that I am sharing. They could be completely wrong Bitcoin could go to 0 next year. Anything is possible. certainly, they will not be exact in the best case as Bitcoin is very unpredictable.
- Everyone has to make their own financial decisions based on their situation.
- This is not financial advice.
However, I will toot my own horn a little bit.
The last time I made a post (back in 2017) predicting Bitcoin cycles my predictions were very accurate and anybody who followed it made a killing.
The post is not live anymore but can be seen on internet archive.
My suggestion for that bull run was to partly sell off above $18k and buy back in after the crash when it goes below $10 000. I predicted it would crash to around $5000. As it turned out the price hit a peak of ~$19k and crashed to ~$3k before going back up.

Not everyone agreed with me though as can be seen above.
The analysis I outline might seem simple, but often simple models are best. These simple models are what many whales in Bitcoin will be used to make their decisions.
Assumptions I make:
- Bitcoin adoption will continue to grow long term.
- As bitcoin gets larger its volatility decreases.
Looking Back
It's stating the obvious to say that the bull market of 2021 has ended and in 2022 we were in a bear. That was not clear yet at the beginning of 2022.
This confusion was because the 2021 bull never had the sharp almost vertical rise and fall the way previous Bitcoin bull markets had. Everyone was expecting it again.
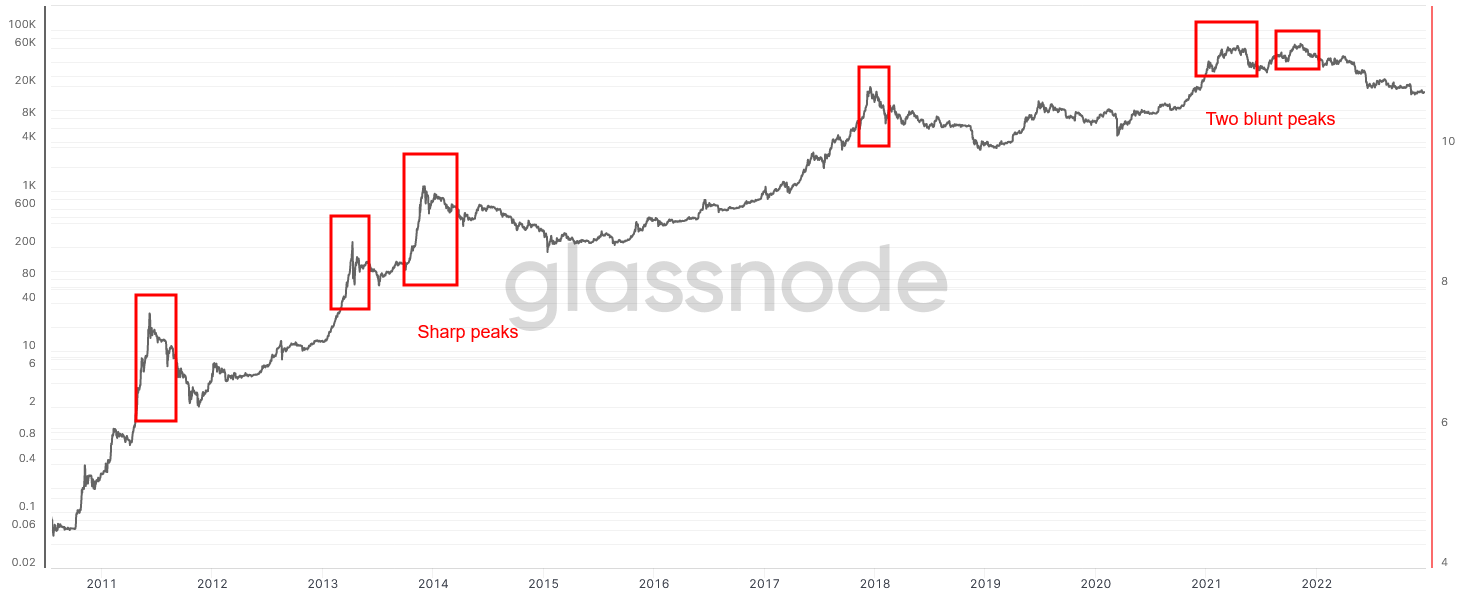
Instead, we got two blunt peaks in the same bull run. The predictions of many Bitcoiners of going well over $100k did not materialise.
It's likely that the market, looking at the same charts we are, learned from the past. Many whales started selling off part (most Bitcoiners say to never sell all) of their stack during the bull run in the hope of buying back at a lower price during the crash i.e. now.
This blunted the peak and should act as support for the price now. Hence less volatility then in the past.
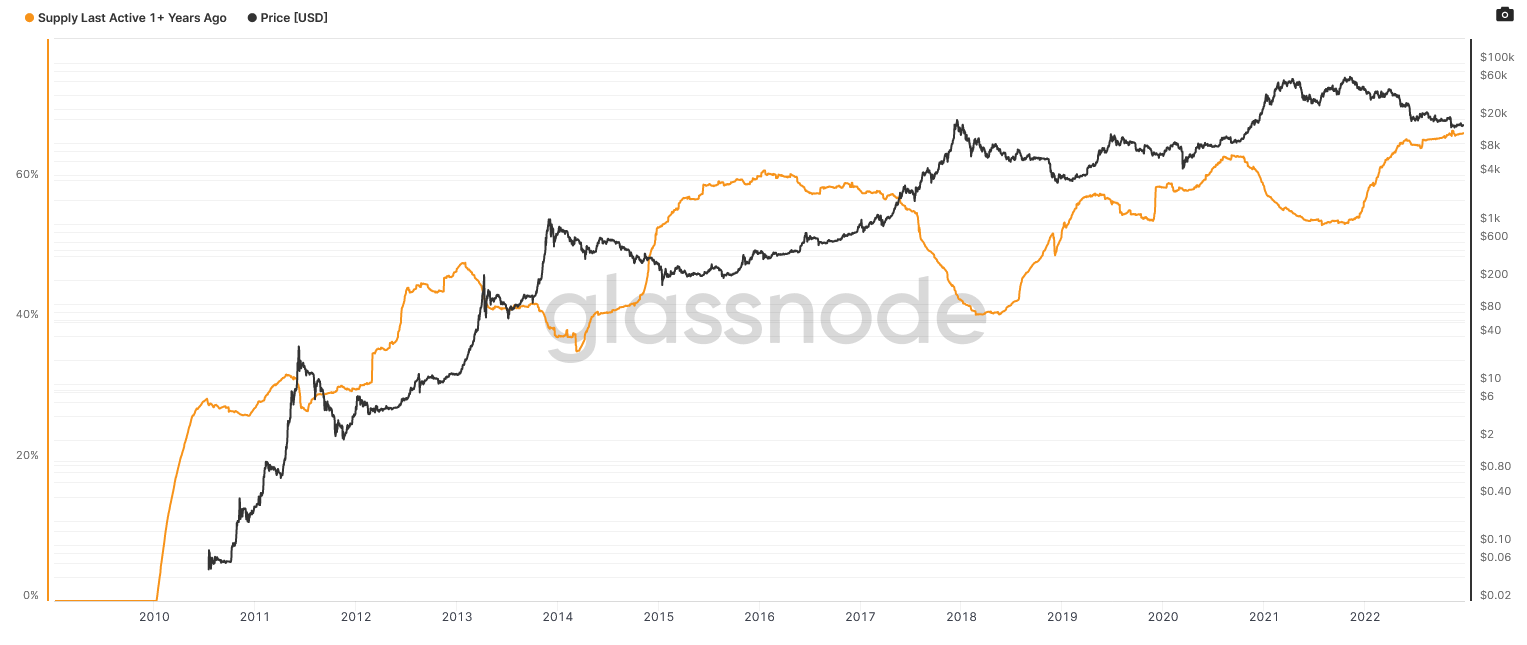
The above chart suggests this showing old coins being moved and likely sold during the bull market.
Comparing Past Cycles
Looking at past cycles we will try and make a guess of what the next few years could bring.
What is my guess of when the next bull run will start? Many expecting a new bull run in 2023 will be disappointed by what I say next.
Let's compare the time between peak prices for each cycle.
Jan 2014 till Jan 2018 = 4 years.
Jan 2018 till Oct 2021 is almost 4 years.
So based on that my guess for the next peak will be ... over 4 years after the last peak i.e. peak early 2026, the bull market to begin in early 2025.
This would mean that the next peak would be about 18 months after the next Bitcoin halving.
To compare the price in cycles I will use the 200 day moving average. This smoothes out the volatility and is a better indicator of where prices were in a given year.
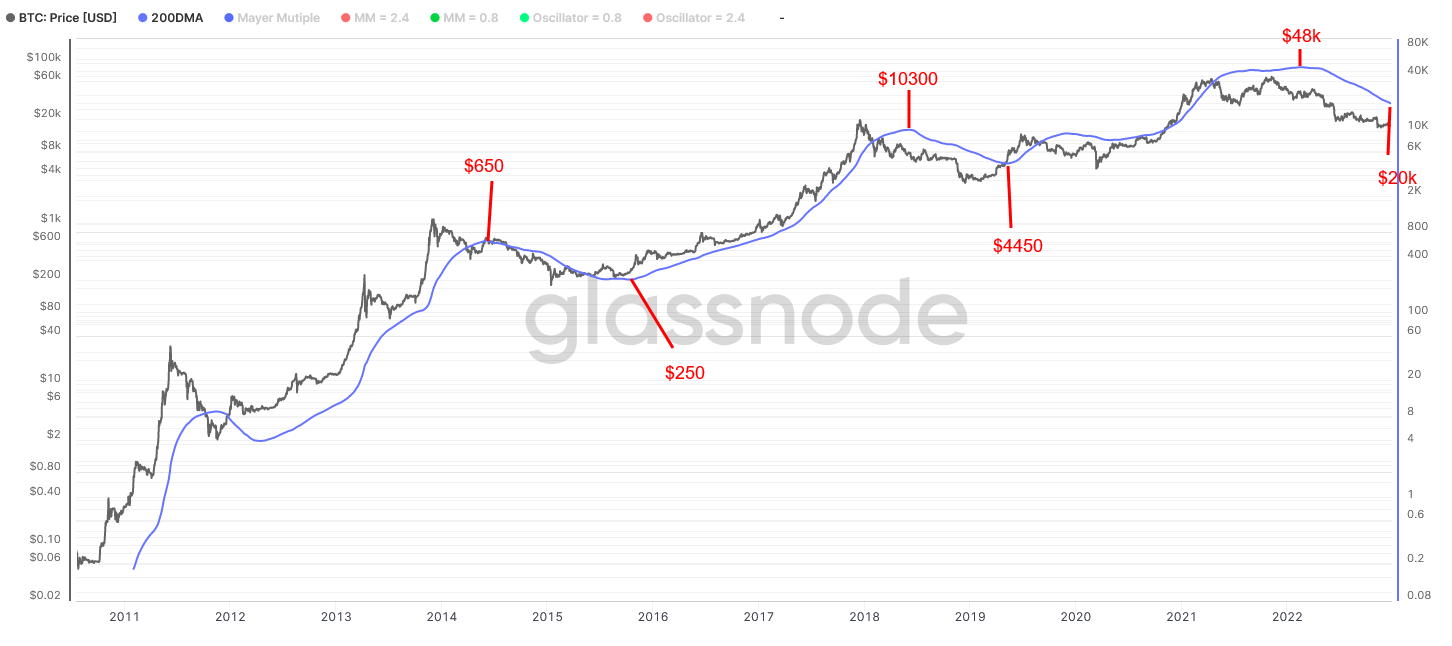
We will compare the ratio of peak to peak and peak to trough to get an idea of where the prices could go this time around.
$10300/650 = 16 – 2014 peak to 2018 peak
$48k/ $10300 = 4.644 – 2018 peak to 2022 peak
So the 2021 bull run was compartively smaller then the 2017 bull run. Which is not surprising given we expect Bitcoin to be less volatile.
So if we make a estimate that the next bull run peak will be 3x the last bull peak.
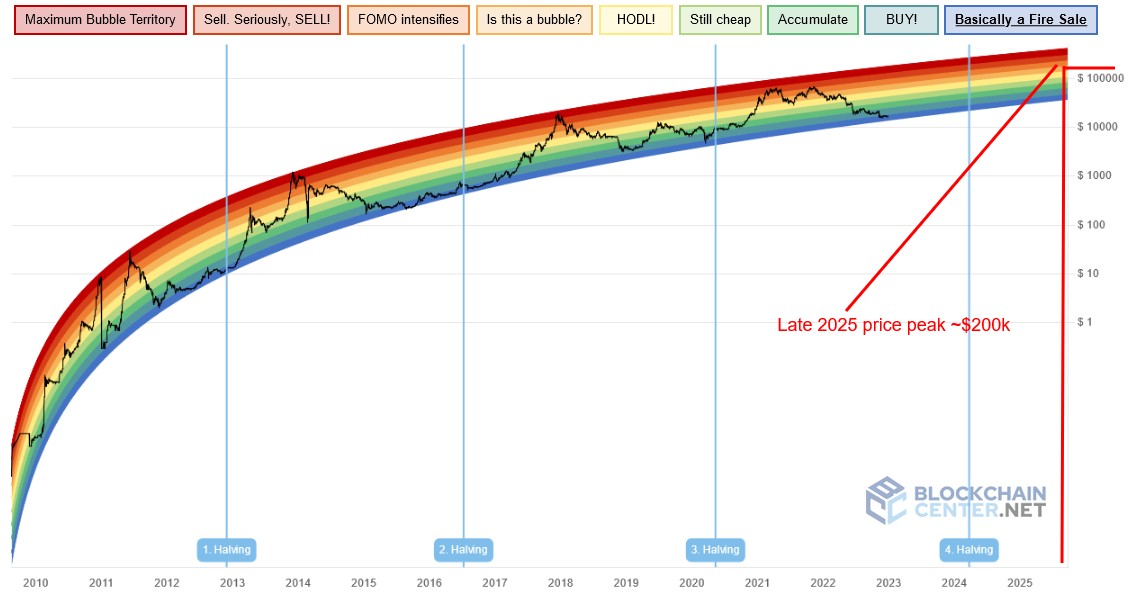
That would give us a price of 3x $48k = $150k peak for the 200-day moving average. The actual interday price might reach upwards of $200k briefly. This is also what the rainbow chart (which is just a curve of best fit), suggests.
And how does the current bear market compare to previous bear markets?
$650/$250 = 2.6 – Peak to trough after 2014 cycle
$10300/$4450 = 2.3 – Peak to trough after 2018
$48k/$20k = 2.4 – Current peak to trough
So based on the past patterns we should be more or less at the bottom now.
And, lets say the price in 2025 does reach $150k, how low would it drop in the subsequent crash?
$150k/2.5 = $60k.
Conclusion
So for everyone asking me what is my prediction of Bitcoin price in the future, my answer is:
I don't truly know and Bitcoin is unpredictable but my best guess is that ...
We will move sidewise in the range $10k -$40k till early 2025. Around 2025 I would expect a bull run that might take us over $150k for a few weeks before dropping again to around $60k.